
Learn what provisioning services are, from food and fresh water to timber and medicines, and why their supply depends on healthy ecosystems.
National Councils for Sustainable Development
Regulating Services: How Ecosystems Keep Conditions Stable
Pros and Cons of Geothermal Energy: A Clear Guide
Explore the pros and cons of geothermal energy, from reliable low-emissions power to cost, location, water, and earthquake risks.
Greenwashing Examples: Famous Cases and Warning Signs
Explore documented greenwashing examples, the seven sins behind misleading claims, and practical ways to spot weak sustainability marketing.
Biomagnification: Definition, Examples and Why It Matters
Learn how biomagnification concentrates pollutants up food chains, with clear DDT and mercury examples, health effects, and common myths.
The Tragedy of the Commons: Meaning, Examples and Solutions
What is the tragedy of the commons? Hardin’s idea, real examples from cod to CO2, Elinor Ostrom’s 8 design principles, and solutions that work.
What Is Ecotourism? Principles, Examples, Greenwashing
What is ecotourism? Learn its 8 core principles, real examples from Costa Rica to Palau, its downsides, and how to spot greenwashing before you book.
Solarpunk: The Hopeful Vision of a Sustainable Future
What is solarpunk? Origins, core ideas, architecture, solarpunk vs. cyberpunk, real-world projects, criticisms, and how you can help build it.
The Phosphorus Cycle: Steps, Human Impact and Why It Matters
Learn how the phosphorus cycle moves through rocks, soil, water, and life—and how fertilizer runoff can disrupt ecosystems.
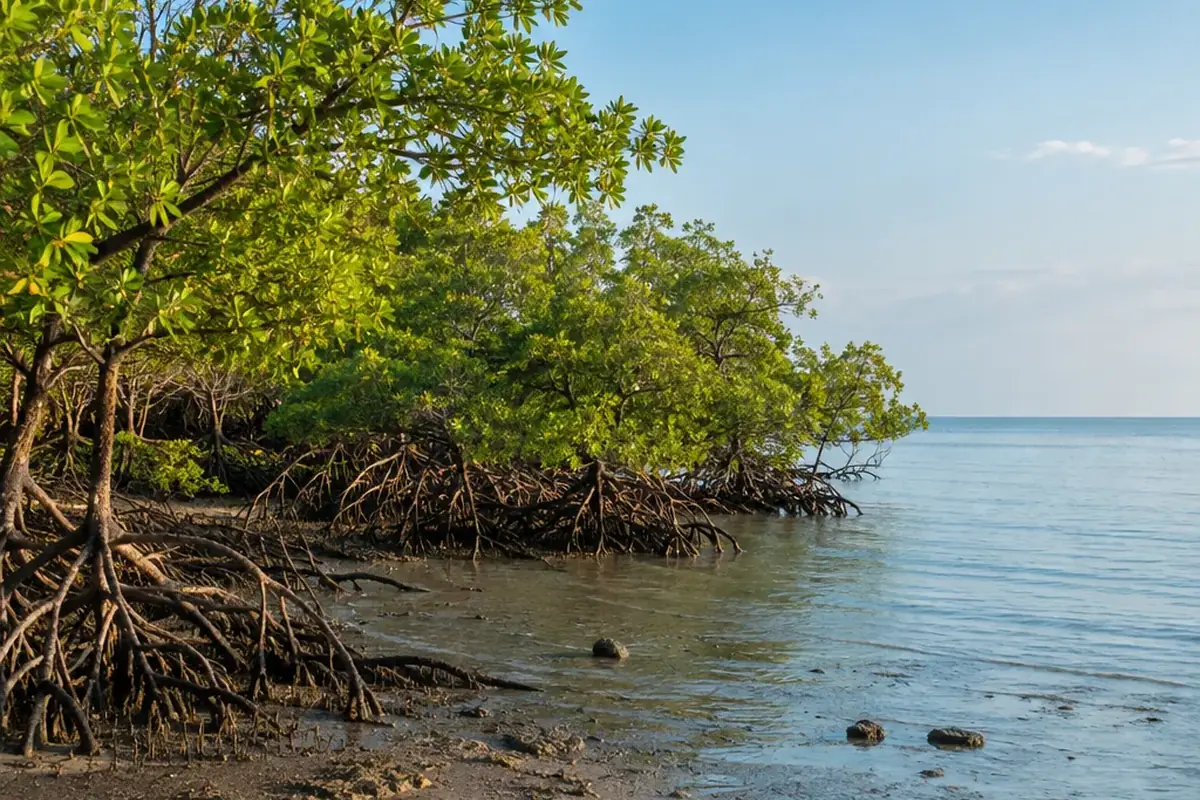
Regulating services are the benefits people get when ecosystems keep natural processes in check. Forests take carbon dioxide out of the air, wetlands filter water, mangroves reduce floods and storm surges, bees pollinate crops, and bats eat crop pests. Regulating services are one of four categories of ecosystem services, and they are often invisible until they fail. New York City demonstrated what they are worth when it protected a watershed instead of building a filtration plant estimated at $4–8 billion.
What Regulating Services Mean
Ecosystem services are “the benefits people obtain from ecosystems.” The framework links biodiversity to human well-being in terms of wealth, nutrition, and security. The Millennium Ecosystem Assessment was a UN-sponsored effort published in 2005. It sorted these benefits into four groups: provisioning, regulating, cultural, and supporting services. In its terms, regulating services are the benefits obtained from the regulation of ecosystem processes. Examples include climate regulation, water purification, disease control, and pollination.
The Common International Classification of Ecosystem Services (CICES V5.1) classifies them under “Regulation and Maintenance.” That category covers the ways living organisms mediate the ambient environment in ways that affect human health, safety, or comfort. Economists call them non-consumptive use values because they provide economic benefits without needing to be harvested, collected, or destroyed during use. This is also why these services are frequently taken for granted; when damaged, the resulting losses can be substantial and difficult to restore.
Regulating vs. Provisioning, Supporting, and Cultural Services
| Category | What it is | Examples | How people benefit |
|---|---|---|---|
| Provisioning | Products obtained from ecosystems | Food, fresh water, timber, fiber, medicinal plants, genetic resources | Directly; usually priced in conventional markets |
| Regulating | Benefits from moderating natural phenomena | Climate regulation, flood control, water purification, pollination, pest control | Directly, but rarely sold in conventional markets |
| Cultural | Non-material benefits | Recreation, aesthetic and spiritual values | Directly, through experience rather than goods |
| Supporting | Internal ecosystem processes | Soil formation, photosynthesis, nutrient cycling, primary production | Indirectly; they underpin all other services |
The key difference between supporting services and regulating services is about who benefits directly. Regulating services deliver direct benefits by moderating natural phenomena, such as a marsh reducing flood levels. Supporting services, such as soil formation and nutrient cycling, sustain the ecosystems themselves. Without them, provisioning, regulating, and cultural services could not exist. CICES V5.1 avoids the terms “intermediate” and “supporting services” entirely, treating these processes as ecosystem functions that support “final services,” and the debate is ongoing.
Categories can overlap. Water counts as a provisioning service when used as drinking water, and as an issue involving regulating services when ecosystems purify it or regulate floods. The categories can also compete: over the past century, provisioning services such as crops, livestock, and aquaculture grew while regulating and cultural services and biodiversity declined.
Examples of Regulating Services, With Numbers
| Regulating service | Who does the work | Scale of the benefit |
|---|---|---|
| Climate regulation and carbon storage | Forests, soils, mangroves, wetlands | Global forests sequestered a net 3.6 billion tonnes of carbon a year, nearly half of fossil fuel emissions |
| Flood and storm protection | Mangroves, coastal wetlands | Mangroves provide more than $65 billion a year in flood protection worldwide |
| Water purification | Wetlands, soil microbes, aquatic ecosystems | Aquatic ecosystems cleanse about 80% of their incident nitrogen loading globally |
| Pollination | Bees, birds, bats, hoverflies | $235–577 billion a year in crop output directly attributable to animal pollination |
| Pest and disease control | Bats, birds, toads, snakes, wasps, frogs, fungi | Intact forests reduce standing water where mosquitoes breed |
| Erosion control | Grass, trees, coral reefs, oyster reefs, seagrass beds | Water erosion costs $3.3 billion a year in lost maize and wheat production |
| Air quality regulation | Trees, lakes | Trees and forests in the conterminous U.S. removed 17.4 million tonnes of air pollution in 2010 |
| Waste decomposition and treatment | Soil microbes, wetlands | Soil microbes break down organic waste and render it less harmful |
Climate Regulation: Where the Carbon Goes
The world’s forests store approximately 861 gigatonnes of carbon, equivalent to nearly a century of current annual fossil fuel emissions. About 44% sits in soil, 42% in live biomass, 8% in dead wood, and 5% in litter. Between 2001 and 2023, global forest ecosystems were a net carbon sink, absorbing roughly twice as much CO2 as they emitted.
Ecosystems differ in how they store carbon. Mangroves exhibit the highest total carbon density among forest types at 529 tonnes of carbon per hectare, driven by soil carbon accumulation. Young tropical forests (0–10 years) show maximum carbon uptake at 8.4 tonnes of carbon per hectare annually, while mature stands older than 120 years decline to approximately 0.9 tonnes per hectare per year. Old-growth forests continue to accumulate carbon: boreal and temperate old-growth alone sequester approximately 1.3 Gt of carbon a year. Wetland plants and soils also store large amounts of carbon that, if released, would contribute to climate change.
Outside urban and agricultural lands, the global forest carbon storage deficit is 226 Gt of carbon. About 61% of this potential lies in existing forests that could recover to maturity.
Wetlands and Mangroves: Natural Hazard Defense
The global median annual value of coastal wetlands for storm protection is estimated at $447 billion a year (2015 dollars), saving an estimated 4,620 lives a year across 40 million hectares in storm-prone areas. Mangroves provide flood protection benefits exceeding $65 billion per year globally; if the world’s mangroves were lost, 15 million more people would be flooded annually.
Locally, one hectare of mangroves in Jamaica provides on average more than $2,500 a year in direct flood reduction benefits from tropical cyclones, and over a 30-year period benefits exceed $43,000 per hectare. During a 1-in-200-year storm, Jamaica’s mangroves protect 177,000 people and nearly $2.4 billion in built capital. In the Philippines, a hectare provides more than $3,200 a year, and property damages would increase by 28%, or over $1 billion annually, without mangroves.
Restoring mangroves globally has a benefit–cost ratio between 3 and 6 under future climate scenarios, with a net present value between $44 billion and $125 billion. Caribbean mangrove restoration costs range from about $14,000 per hectare in Grenada to $45,000 in Florida, with median costs around $23,000 per hectare outside Florida. In San Francisco Bay, restored marsh at one site south of SFO provides a present value of $900,000 per hectare, increasing to $9.2 million per hectare with 0.5 m of sea-level rise.
Erosion Control on Land and Shore
Vegetation such as grass and trees prevents soil loss due to wind and rain and prevents siltation of waterways, while forests on slopes hold soil in place and prevent landslides. Offshore, coral reefs, oyster reefs, and seagrass beds reduce the loss of land and beaches to waves and storms. Water erosion reduces global maize production by 8.9 million tonnes and wheat by 5.6 million tonnes annually, valued at $3.3 billion, with nitrogen fertilizer replacement adding $0.9 billion. Soil erosion has affected 25% of agricultural land in the European Union and 23% in Central Asia. Anti-erosion measures have a median cost of $500 per hectare, while restoration of already-eroded land costs $1,500–2,000 per hectare.
Clean Water Without a Treatment Plant: The Catskills Case
Wetlands remove harmful pollutants by trapping metals and organic materials. Their plants absorb nutrients and chemicals as a natural filtration system, and soil microbes degrade organic waste. Aquatic ecosystems cleanse an average of 80% of their incident nitrogen loading, but wetland loss is reducing this self-purification capacity.
In the 1990s, facing an EPA mandate to build a water filtration plant estimated at $4–8 billion in capital costs plus $250 million in annual operating costs, New York City invested instead in watershed protection in the Catskill-Delaware watershed. The city spent approximately $1.5 billion on source water protection between 1991 and 2010 for land purchases, farm programs, and infrastructure upgrades. Three key components supported the initiative:
- Farm partnerships: under the Watershed Agricultural Program, farmers developed tailored “Whole Farm Plans,” with 93% of watershed farmers participating within five years.
- Land protection: the Watershed Agricultural Council had invested over $39 million in conservation easements by the end of 2010.
- Monitoring: the city’s DEP conducts 330,000 tests a year from 1,000 locations in the city and 230,000 tests in the watershed.
The program achieved a 75–80% reduction in farm pollution loading and saved over $1 billion annually compared to filtration. Water and sewer rate increases dropped from 14% a year in the 1980s to zero for two years starting in 1993, remaining at or below inflation through 2002. As of 2020, more than two decades after the program began, the city still held its filtration avoidance permit.
Other examples illustrate similar economic values. The Nakivubo Swamp in Kampala, Uganda (approximately 5.5 km²), provides wastewater treatment services valued at up to $2 million per year, matching the cost of artificial sewage treatment infrastructure. In Santa Monica, an urban runoff treatment plant (SMURFF) has annualized costs of approximately $1.3 million per year over 50 years to provide water quality services similar to a 4,000–5,000-foot riparian corridor.
Pollination and Pest Control on the Farm
Nearly 90% of wild flowering plant species depend at least in part on animal pollination. More than three-quarters of the leading types of global food crops rely to some extent on animal pollination for yield or quality, and pollinators affect 35% of global crop production. Pollinator-dependent crops supply major proportions of micronutrients, vitamins, and minerals, including vitamin A, iron, and folate. In the UK, pollinators are conservatively valued at £430 million per annum, and 20% of the UK cropped area comprises pollinator-dependent crops.
The volume of agricultural production dependent on animal pollination has increased by 300% over the past 50 years, but these crops show lower growth and yield stability than non-dependent crops. Managed honey bees and wild pollinators, primarily non-managed bees and hoverflies, have been in severe decline for the past 30 years.
Ecosystems regulate pests and diseases through predators and parasites. A single ladybird attacking aphids is an example of natural pest control. Bats, toads, and snakes from nearby forests consume crop pests, while birds, flies, wasps, frogs, and fungi act as natural controls. Pesticide use has degraded this regulation. Ecosystem modifications have also altered disease patterns: intact forests reduce standing water where mosquitoes breed and can reduce malaria prevalence, while dams and irrigation canals provide habitat for schistosomiasis.
Why Regulating Services Are Declining, and How to Count Them
The Millennium Ecosystem Assessment found that approximately 60% of evaluated ecosystem services (15 of 24) were degraded or used unsustainably, including 70% of regulating and cultural services. Documented declines occurred in air quality regulation, climate regulation, erosion regulation, water purification, pollination, and natural hazard regulation. The IPBES Global Assessment (2019) found that 14 of 18 assessed categories of nature’s contributions to people, mostly regulating and non-material contributions, have declined since 1970. In Europe and Central Asia, wetland extent declined by 50% since 1970.
Most changes to regulating services were inadvertent results of actions taken to enhance provisioning services, such as expanding agriculture at the cost of forests and wetlands. A principal reason for their decline is that their true values are not considered in economic decision-making, as most decisions are based on market prices where no markets for regulating services exist. This decline also signals that ecosystem resilience is being eroded, foreshadowing future declines in other ecosystem services.
Putting a Price on Invisible Work
Two cost-based valuation methods are most commonly applied to regulating services:
- Damage cost avoided: calculates either the value of property protected or the costs people incur to avoid damages, such as flood protection benefits measured by avoided property damage.
- Replacement cost: uses the cost of replacing an ecosystem service with human-made technology, such as building a water treatment plant to replace natural wetland filtration.
A weakness of cost-based methods is that they do not strictly measure willingness to pay, requiring assumptions about whether people would accept the substitute or incur the cost. For Europe and Central Asia, the IPBES assessment quantified median annual values per hectare at $1,965 for freshwater quality regulation, $765 for habitat maintenance, $464 for climate regulation, and $289 for air quality regulation.
What Decision-Makers Can Do
- Account for natural infrastructure alongside built technology in economic decision-making, as demonstrated by watershed protection in New York City.
- Prioritize conservation before restoration: anti-erosion measures cost a median of $500 per hectare compared to $1,500–2,000 for restoring eroded land, and 61% of the forest carbon storage deficit lies in existing forests.
- Target restoration where benefit–cost ratios are highest, such as global mangrove restoration with ratios of 3 to 6.
- Engage land managers through tailored Whole Farm Plans and conservation easements to reduce agricultural pollution.
- Conduct continuous monitoring of environmental indicators to verify service performance.
Common Misconceptions About Regulating Services
“Old forests are carbon neutral.”
Old-growth forests between 15 and 800 years old continue to accumulate carbon, contradicting the view that ageing forests are carbon neutral. Boreal and temperate old-growth forests alone sequester approximately 1.3 Gt of carbon a year.
“More vegetation always means cleaner air.”
Trees and forests in the conterminous United States removed 17.4 million tonnes of air pollution in 2010, an effect valued at $6.8 billion that included avoiding more than 850 human mortality incidents and 670,000 acute respiratory symptom incidents. Uptake occurs via leaf stomata, permanently converting gases like SO2, NO2, CO, and ozone. Urban vegetation can reduce particulate matter by 16.5–26.7% and SO2 by 20.5–47.8%. However, biogenic volatile organic compound emissions from vegetation can increase ground-level ozone by 5.1–25.9%, and vegetation fires emit pollutants. Ecosystems therefore act as both sources and sinks for air pollutants.
“If it’s free, it has no economic value.”
Ecosystem services provide non-consumptive use values. They often lack market prices because no conventional markets exist for them, not because they lack economic value.
“Technology can simply replace nature.”
Replacing ecosystem functions with technology involves substantial expenditure. In Santa Monica, an urban runoff treatment plant costs approximately $1.3 million per year over 50 years to match the water quality services of a 4,000–5,000-foot riparian corridor, replacing only a single function rather than the combined services of a natural ecosystem.
Frequently Asked Questions
What are examples of regulating services?
Examples of regulating services are pollination, decomposition, water purification, erosion and flood control, carbon storage, climate regulation, air quality regulation, and pest and disease control.
What do regulating services do?
They keep environmental conditions within a range people can live with. Forests and wetlands store carbon, mangroves blunt storm surges, wetlands filter water, pollinators raise crop yields, and predators hold pests in check.
What are ecosystem services, and how do they benefit people?
Ecosystem services are the benefits people obtain from ecosystems. They fall into four categories: provisioning (products such as food and fresh water), regulating (such as flood control), cultural (such as recreation), and supporting (such as soil formation).
What are five examples of ecosystem services?
Five examples are food production (provisioning), pollination (regulating), climate regulation (regulating), water purification (regulating), and recreation (cultural).
What is the difference between supporting services and regulating services?
Regulating services provide direct benefits by moderating natural phenomena, such as flood control and pollination. Supporting services, such as soil formation and nutrient cycling, are internal processes that sustain ecosystems and benefit people indirectly by underpinning all other services.
What are examples of provisioning services?
Provisioning services include food, fresh water, timber, fiber, medicinal plants, and genetic resources. These are products obtained from ecosystems with clear monetary value in conventional markets.
How do regulating services help protect and maintain ecosystems?
They moderate natural processes, protect shores from erosion, decompose waste, and regulate pests. Their degradation signals that ecosystem resilience is eroding and foreshadows future declines in other ecosystem services.
Related explainers
Sustainable development meets the needs of the present without compromising the ability of future generations to meet their own.